封關之後就是大家自我充電最好的時候了。我在這裡提供一個公開的Momentum指標判定方式,內容包含一點過濾盤整的概念。附上影片及文章說明,如果英文不好懂的話,看圖大概就懂了。依據作者的意思,本文僅限教學使用,請勿用於金融實際交易上,否則風險自行承擔。
影片說明: http://www.tradeology.com/lessons/momentum/momentum/momentum_media/momentum.wmv
轉貼自:http://www.tradeology.com/momentum.html
Overview
The Momentum indicator measures the rate of change from the most recent close to that of close X periods ago and then multiplies the result by 100. Basically, it lets you know if there's any force (momentum) in the market. It is generally plotted around a zero line where readings above zero are considered to be bullish and readings below zero are considered bearish. Remember, readings below zero can still have momentum, but it is then negative momentum.
The problem with all lagging indicators is that they are generally not quite accurate on their own. You need something to confirm the signal. Either another indicator or a chart pattern or some technique that works well with that particular indicator.
How to calculate the Momentum Indicator
It is a simple calculation. For each bar, the momentum is calculated as the difference in price between that bar and the bar of a fixed number of periods ago, then multiplied by 100. It is normally based on the closing price but some charting services will give you other options.
Momentum is calculated as a ratio of the price to the price several (X) periods ago.
MOMENTUM = CLOSE(x)/CLOSE(i-x)*100
Where:
CLOSE(x) — is the closing price of the current bar;
CLOSE(i-x) — is the closing price x periods ago.
Some Trading Ideas
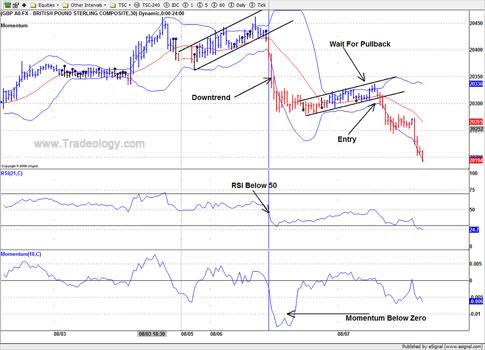
Have a look at the chart below. You can see that the market is in a downtrend. Wait for a pullback (rally), once you see the pullback, wait for a confirmation that the trend is continuing down by the combination of a break in a trend line and the RSI moving below 50 and Momentum moving back below zero.
Use the upper Bollinger Band as your stop loss level and exit once the RSI turns back above 50 and Momentum crosses back above zero. You could also exit once the markets hits a strong support or any other means that suits your trading style
More Trading Ideas
The rising momentum line signals that the uptrend is getting stronger and a falling line means that the downtrend is getting stronger. The buy signal happens when the indicator is turning up, the sell signal - when it is turning down.
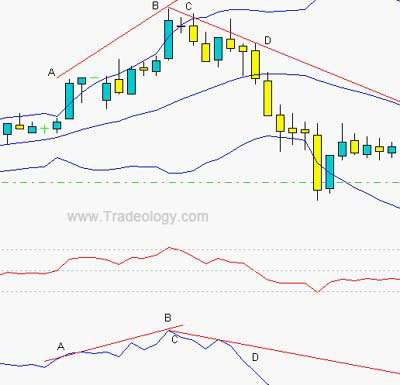
This momentum up and down can be used for identifying trends, overbought/oversold conditions and divergences.
Above is a 1 hr chart of the EUR/USD where you can see this momentum line rising A-B, signaling an uptrend. The momentum line falling C-D, signaling a downtrend.
Interpretation
In this example we will be using the Momentum indicator as a trend-following oscillator similar to the MACD set at 14 this time. Buy when the indicator bottoms and turns up or sell when the indicator peaks and turns down but use this information together with RSI set at 14 and Bollinger Bands set at 20.
==================
Side Note:
The video shows a Momentum setting of 10 and the RSI setting at 21. Those are my preferred settings for that method. The idea of this lesson and the video is to get you to experiment with Momentum as an indicator.
==================
Example Short:
Sell Signal:
The following chart shows a 1hr EUR/USD chart and its 14-day momentum (blue line), 14 day RSI (red line) and Bollinger bands set at 20.
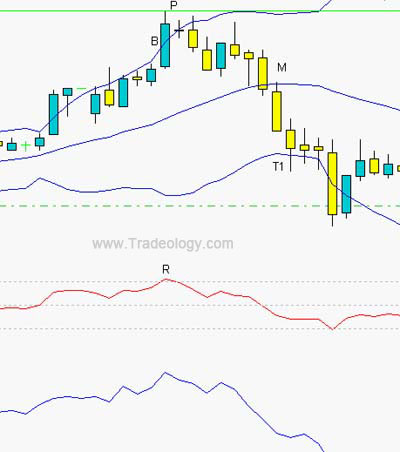
Start by identifying an area where the RSI crosses over the 70 line (Point R) and enters overbought country, together with this cross I am looking for the price to touch the upper channel of the Bollinger band (Point B).
One possible way of trading this method is the following:
- Although the momentum is also showing overbought at the same place the RSI is overbought, this could just be a strong trend. So wait for the momentum indicator to start dropping with the RSI and once the price touches the middle Bollinger band (Point M), place an entry to go short the market.
- Place your stop loss just above the peak that was formed (Point P), which was also where the RSI topped out (Point R) and follow the trade down.
- Once the price hits the lower Bollinger band (Point T1) you can exit the trade.
You are welcome to use your own exit strategy and this is only one method that I found worked very well.
Example Long:
Buy Signal:
The following chart shows a 1hr EUR/USD chart and its 14-day momentum (blue line), 14 day RSI (red line) and Bollinger bands set at 20.
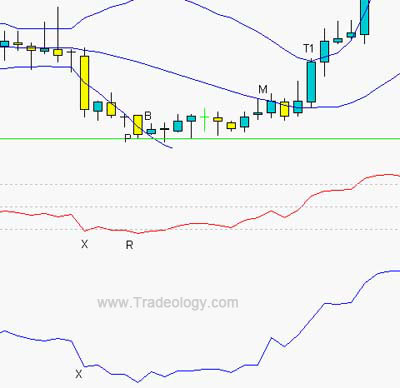
Start by identifying an area where the RSI crosses below the 30 line (Point R) and price touches the lower Bollinger band (Point B).
One possible way of trading this method is the following:
- Although the momentum is also showing oversold, wait for a signal to develop. Wait for the momentum indicator to start rising with the RSI and once the price touches the middle Bollinger band (Point M), place an entry to go long the market. An important point I would like to raise here is that where the RSI first crossed below the 30 line (Point X) would have been your first choice BUT the momentum then carried on downward, which is exactly the point I want to make on how strong the momentum indicator can be in “filtering” signals.
- Place your stop loss just below the valley that was formed (Point P), which was also where the RSI bottomed out (Point R), then follow the trade up.
- Once the price hits the upper Bollinger band (Point T1) you can exit
the trade.
Experiment with this indicator and I am sure you will find it useful in your trading.
Good Trading
Mark McRae

 留言列表
留言列表